Check your website positions in search engines
How much does it cost?
Linktrust provide services using payment model pay-as-you-go, which means there're no monthly payments. Each service costs fixed amount of internal currency - tokens.
OK — Tool enabledTOP-20 (х1)
1 tokens / ~0.0036$
TOP-50 (х2)
2 tokens / ~0.0072$
TOP-70 (х3)
3 tokens / ~0.0108$
TOP-100 (х4)
4 tokens / ~0.0144$
How does it work?
You can create any amount of projects and clusters inside it
01
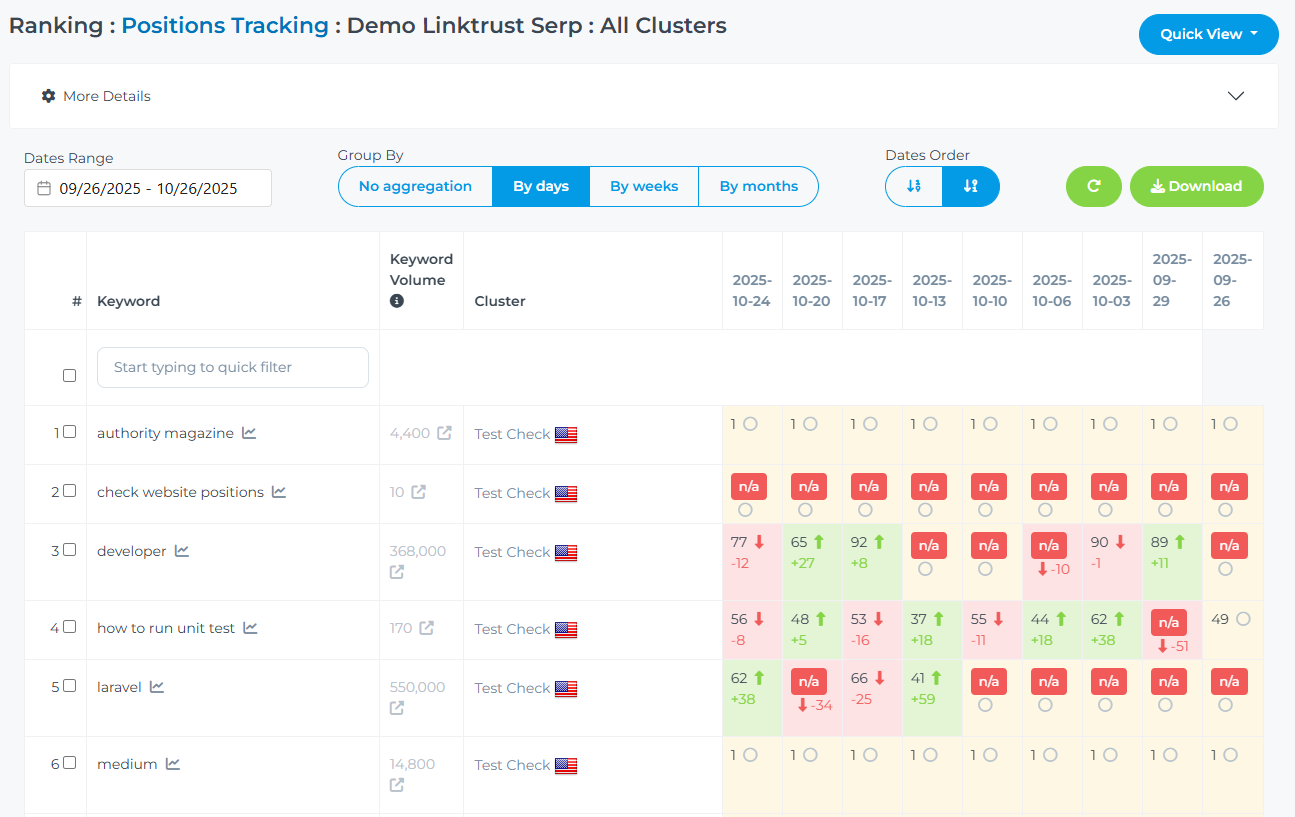
Positions Report
In positions report for each key you get:
- Keyword frequency — the number of times a keyword is searched per month. You can also view keyword analytics and similar keywords for free, then add them to a cluster.
- Search position — we determine your domain’s position, the found URL, competitors positions, and the delta showing position changes compared to the previous check. We scan positions multiple times in order to find the best position your domain has been in SERP.
- Found URL — we check whether the URL you specified matches the one found in search results at the nearest position. This helps you see if a different page appeared in search results than expected.
- Keyword history — we save the TOP-10 positions for each keyword check, allowing you to see ranking positions for specific periods of time.
- Filters, sorting, and aggregation — allow you to build reports in any needed variations.
02
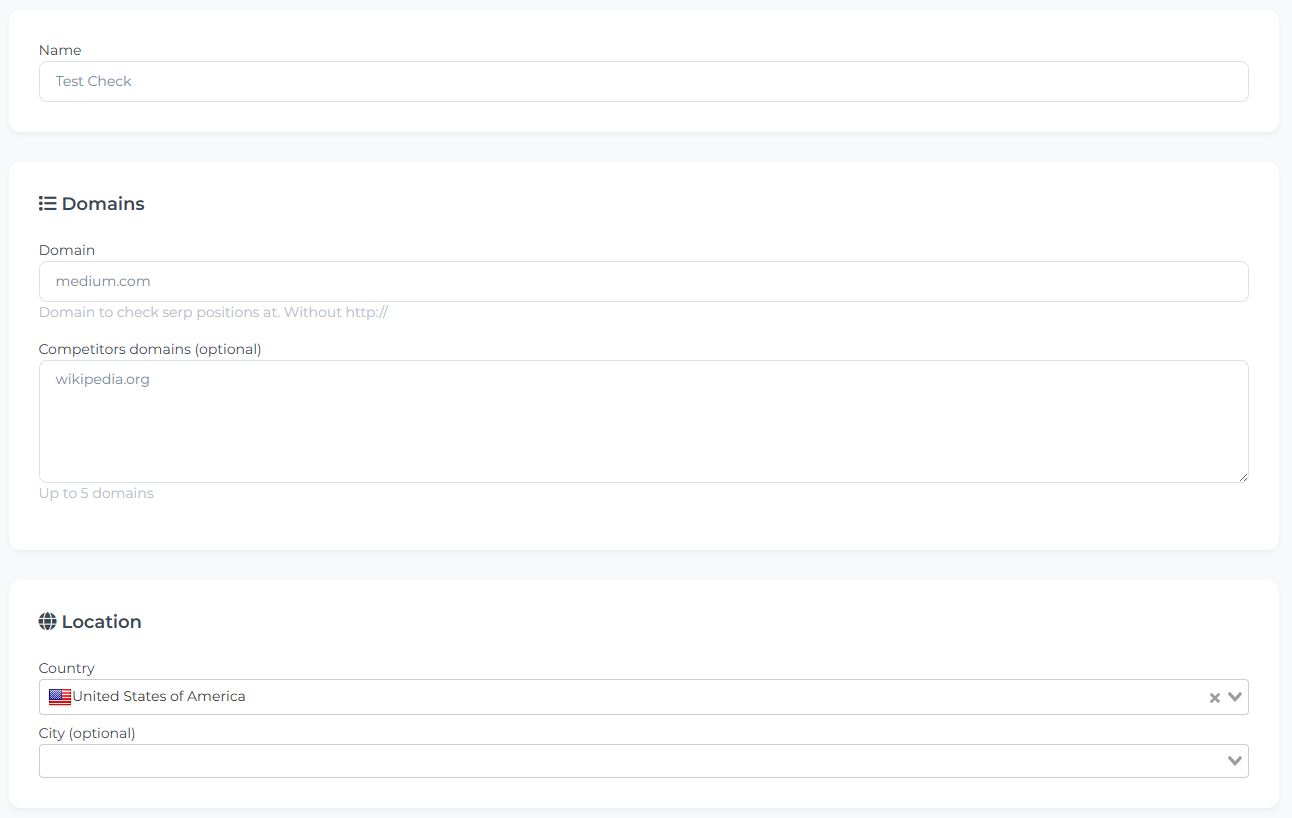
Clusters Configuration
For each cluster you can set up:
- Domain — the domain whose positions will be checked within the project.
- Competitor domains — a list of your competitors’ domains for which we will track positions using the same keywords (competitor position tracking is included in the price).
- Country + City — specifies the country for which search results will be checked (optionally, you can also specify a city).
- Keywords — you can add up to 5000 keywords to each cluster.
- Schedule — position checks can be done manually or automatically according to a schedule.
- Public link — you can create a unique link to share the project’s position data with your client.
03
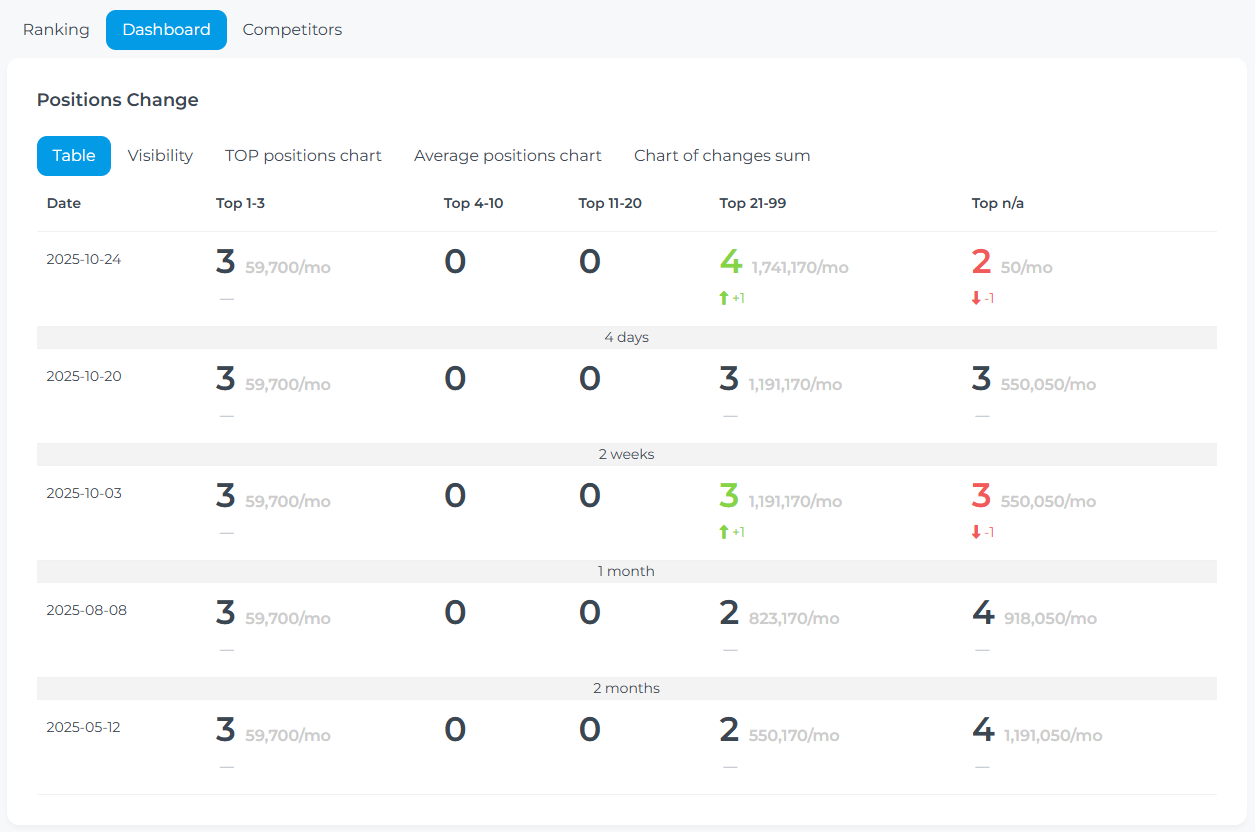
Dashboard and Metrics
We aggregate positions into different reports which would allow to understand trends and find positions you need to pay more attention to.
- Position dynamics — the overall trend of positions over several months. It visually shows how the number of positions changes depending on the TOP ranges.
- Visibility — calculated as the ratio of (sum of estimated traffic / total possible traffic volume across all keywords).
- Charts of TOPs, average positions, and total changes — a visual representation of ranking changes in position tracking.
- Historical TOPs — the number of keywords in TOP-3, TOP-5, TOP-10, TOP-20 for each tracking date.
- Cumulative changes — accumulated sum of position changes by date to evaluate overall progress.
- Average positions — the average ranking across all keywords over time.
- Keyword performance — the best, current, and initial position for each keyword.
04
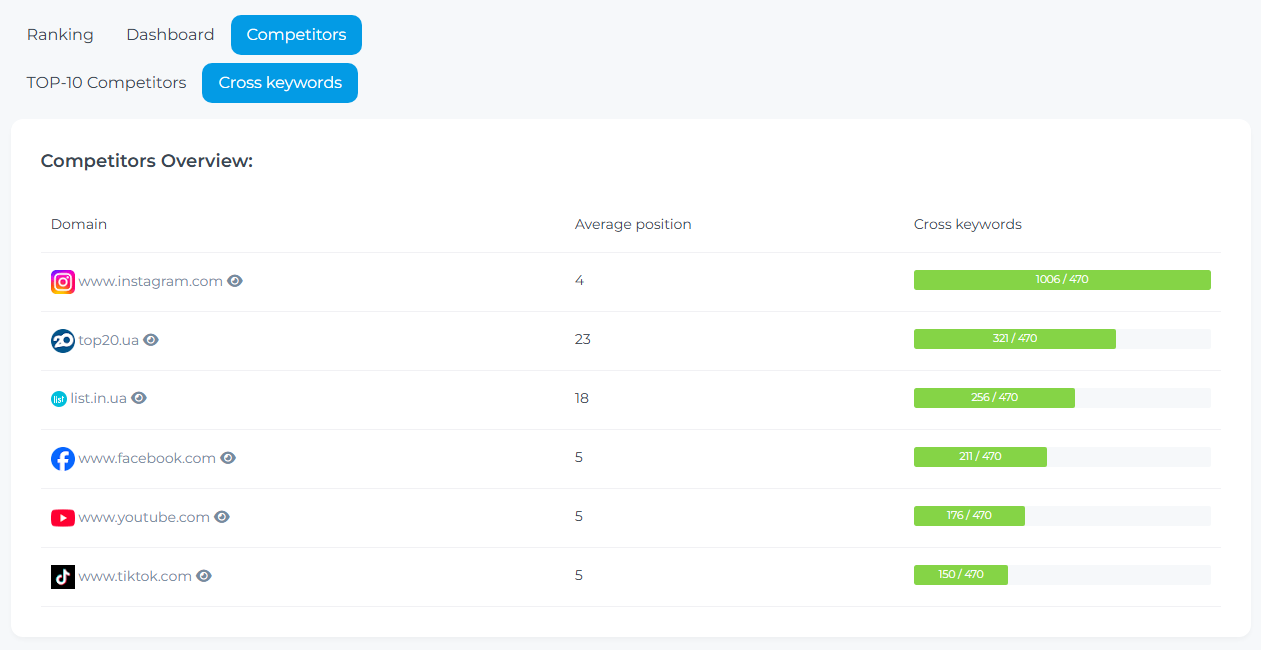
Competitor Analysis
The system automatically identifies competitors from the TOP-10 and lets you track their positions:
- Auto-detection — we analyze TOP-10 results for each keyword and identify domains that most frequently overlap with your search results.
- Competitor positions — the report shows competitor positions alongside your own for each keyword.
- Manual adding — specify competitor domains manually at the cluster or project level.
05
Keyword Management & Bulk Operations
Convenient tools for working with large keyword sets:
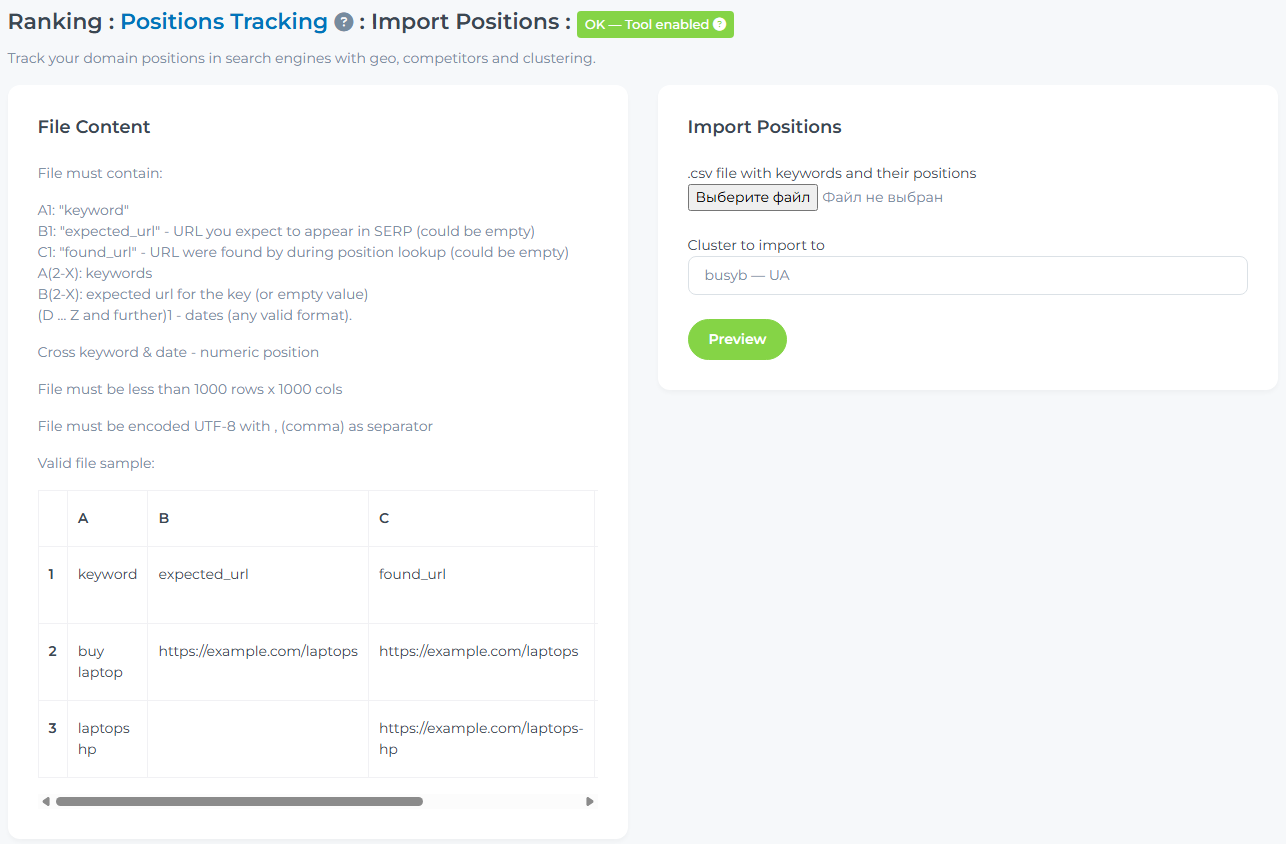
- CSV import — upload a keyword list from a file with a preview before importing.
- Keyword tags — add tags via modifier (keyword|tags:brand,promo) to group and filter keywords in reports.
- Move between clusters — transfer or copy keywords while preserving the full position history.
- Clone cluster — fully duplicate a cluster along with its keyword list and settings.
- Compare clusters — compare keywords and positions across multiple clusters in one report.
- CSV export — download a consolidated file with all keywords and their positions for each tracking date.
FAQ
How do you fetch positions?
We fetch positions multiple times because SERP is quite unstable and can show different positions for your domain (anywhere from top-10 to not appearing at all). Essentially, the found position is "The best position we could see in the SERP". Tracking works best when you check positions multiple times within a cluster — we aim to make position tracking as stable as possible.
Why can the position differ from what I see in Google?
SERP is unstable by nature — even in incognito mode, the same query from two different devices can return different results. Google constantly runs tests, shifting positions of individual sites. Any domain can in some cases appear in the top-10 and in others be completely absent or have a very low position.
How is visibility calculated?
Visibility shows what percentage of potential traffic you are getting from your keywords. For each keyword that ranked in the top-10, we multiply its search volume by the CTR of its position (e.g. position 1 — 27.6%, position 2 — 15.8%, position 3 — 11%, etc.). The sum of these values is divided by the total volume of all keywords at position 1 — that is your visibility percentage. 100% visibility means all your keywords are at position 1.